
领先一步
VMware 提供培训和认证,助您加速进步。
了解更多Spring可观测性团队在为Spring应用程序添加可观测性支持方面已经工作了一段时间,我们很高兴地通知您,此功能将随Spring Framework 6和Spring Boot 3一起正式发布!
什么是可观测性?在我们看来,它是“通过检查系统的输出,您能够多好地理解系统内部”。我们相信,指标、日志和分布式跟踪之间的相互关联,使您能够对系统状态进行推理,从而调试应用程序中的异常和延迟。您可以在本期与 Jonatan Ivanov 的 Enlightning 节目中观看更多关于我们对可观测性的看法。
即将发布的 Spring Boot 3.0.0-RC1 版本将包含许多自动配置,用于改进 Micrometer 的指标和 Micrometer Tracing(以前是 Spring Cloud Sleuth)的新分布式跟踪支持。最显著的变化是它将包含对日志关联的内置支持,W3C 上下文传播将成为默认传播类型,并且我们将支持自动传播元数据,供跟踪基础设施(称为“远程行李”)使用,以帮助标记观测结果。
在今年,我们对 Micrometer API 进行了很多更改。最重要的变化是,我们引入了一个新的 API:Observation API。
其创立的理念是,我们希望用户使用单个 API 对其代码进行一次检测,并从中获得多重好处(例如,指标、跟踪、日志记录)。
这篇博客文章详细介绍了您需要了解的有关该 API 的信息以及如何使用它来为您的应用程序提供更多洞察。
要进行任何观测,您需要通过 ObservationRegistry 注册 ObservationHandler 对象。ObservationHandler 只对 Observation.Context 的受支持实现做出反应,并且可以通过对观测的生命周期事件(例如)做出反应来创建计时器、跨度和日志:
start - 观测已启动。在调用 Observation#start() 方法时发生。
stop - 观测已停止。在调用 Observation#stop() 方法时发生。
error - 观测时发生错误。在调用 Observation#error(exception) 方法时发生。
event - 观测时发生事件。在调用 Observation#event(event) 方法时发生。
scope started - 观测打开一个范围。范围在不再使用时必须关闭。处理程序可以在启动时创建线程局部变量,这些变量在范围关闭时被清除。在调用 Observation#openScope() 方法时发生。
scope stopped - 观测停止一个范围。在调用 Observation.Scope#close() 方法时发生。
每当调用这些方法中的任何一个时,都会调用一个 ObservationHandler 方法(例如 onStart(T extends Observation.Context ctx)、onStop(T extends Observation.Context ctx) 等)。为了在处理程序方法之间传递状态,您可以使用 Observation.Context。
观测状态图如下所示
        Observation           Observation
        Context               Context
Created ----------> Started ----------> Stopped
观测范围状态图如下所示
              Observation
              Context
Scope Started ----------> Scope Closed
为了能够调试生产问题,观测需要额外的元数据,例如键值对(也称为标签)。然后,您可以使用这些标签查询您的指标或分布式跟踪后端,以查找所需数据。标签可以是高基数或低基数。
这是 Micrometer Observation API 的一个示例。
// Create an ObservationRegistry
ObservationRegistry registry = ObservationRegistry.create();
// Register an ObservationHandler
registry.observationConfig().observationHandler(new MyHandler());

// Create an Observation and observe your code!
Observation.createNotStarted("user.name", registry)
        .contextualName("getting-user-name")
        .lowCardinalityKeyValue("userType", "userType1") // let's assume that you can have 3 user types
        .highCardinalityKeyValue("userId", "1234") // let's assume that this is an arbitrary number
        .observe(() -> log.info("Hello")); // this is a shortcut for starting an observation, opening a scope, running user's code, closing the scope and stopping the observation
重要
高基数意味着一个对将具有无限数量的可能值。HTTP URL 是这种键值的一个很好的例子(例如,/user/user1234、/user/user2345 等)。低基数意味着一个键值将具有有限数量的可能值。模板化HTTP URL(例如 /user/{userId})是这种键值的一个很好的例子。
为了将观测生命周期操作与观测配置(例如名称以及高基数和低基数标签)分开,您可以使用 ObservationConvention,它提供了一种覆盖默认命名约定的简便方法。
最简单的入门方法是使用 https://start.spring.io 创建一个新项目。请务必选择 Spring Boot 3.0.0-SNAPSHOT(发布 RC1 后您可以切换到 RC1)以及您喜欢的构建工具。
我们将构建一个 Spring WebMvc 服务器应用程序和一个使用 RestTemplate 调用服务器的客户端。我们从服务器端开始。
由于我们要启动一个 HTTP 服务器,因此我们必须选择 org.springframework.boot:spring-boot-starter-web 依赖项。
要使用 @Observed 切面创建观测,我们需要添加 org.springframework.boot:spring-boot-starter-aop 依赖项。
要为您的应用程序添加观测功能,请选择 spring-boot-starter-actuator(将 Micrometer 添加到类路径)。
现在是时候添加与可观测性相关的功能了!
指标
io.micrometer:micrometer-registry-prometheus 依赖项。跟踪
对于使用 Micrometer Tracing 的跟踪上下文传播,我们需要选择一个tracer桥(tracer是用于处理跨度生命周期的库)。我们通过添加 io.micrometer:micrometer-tracing-bridge-brave 来选择 Zipkin Brave。
为了延迟可视化,我们需要将完成的跨度以某种格式发送到服务器。在我们的例子中,我们生成一个 Zipkin 兼容的跨度。为了实现这一点,我们需要添加 io.zipkin.reporter2:zipkin-reporter-brave 依赖项。
日志
com.github.loki4j:loki-logback-appender 依赖项来实现这一点(请查看 此链接 获取最新发布版本)。重要
如果您是跟踪新手,我们需要快速定义几个基本术语。您可以将任何操作包装在 span 中。它具有唯一的 span id 并包含时间信息和一些附加元数据(键值对)。由于您可以从跨度生成子跨度,因此整个跨度树形成一个共享相同 trace id(即关联标识符)的 trace。
现在我们需要添加一些配置。我们设置 actuator 和 metrics 以发布百分位数直方图,并重新定义日志模式以包含跟踪和跨度标识符。我们将采样概率设置为 1.0 以将所有跟踪发送到延迟分析工具。
/src/main/resources/application.properties
server.port=7654
spring.application.name=server

# All traces should be sent to latency analysis tool
management.tracing.sampling.probability=1.0
management.endpoints.web.exposure.include=prometheus

# For Exemplars to work we need histogram buckets
management.metrics.distribution.percentiles-histogram.http.server.requests=true

# traceID and spanId are predefined MDC keys - we want the logs to include them
logging.pattern.level=%5p [${spring.application.name:},%X{traceId:-},%X{spanId:-}]
由于我们正在本地运行带有 Loki 和 Tempo 的 Grafana 栈,我们将 loki-logback-appender 配置为将日志发送到本地 Loki 实例。
/src/main/resources/logback-spring.xml
<?xml version="1.0" encoding="UTF-8"?>
<configuration>
    <include resource="org/springframework/boot/logging/logback/base.xml" />
    <springProperty scope="context" name="appName" source="spring.application.name"/>

    <appender name="LOKI" class="com.github.loki4j.logback.Loki4jAppender">
        <http>
            <url>https://:3100/loki/api/v1/push</url>
        </http>
        <format>
            <label>
                <pattern>app=${appName},host=${HOSTNAME},traceID=%X{traceId:-NONE},level=%level</pattern>
            </label>
            <message>
                <pattern>${FILE_LOG_PATTERN}</pattern>
            </message>
            <sortByTime>true</sortByTime>
        </format>
    </appender>

    <root level="INFO">
        <appender-ref ref="LOKI"/>
    </root>
</configuration>
是时候编写一些服务器端代码了!我们希望实现应用程序的全面可观测性,包括指标、跟踪和附加日志记录。
首先,我们编写一个控制器,它将消息记录到控制台并将工作委托给服务。
MyController.java
@RestController
class MyController {

    private static final Logger log = LoggerFactory.getLogger(MyController.class);
    private final MyUserService myUserService;

    MyController(MyUserService myUserService) {
        this.myUserService = myUserService;
    }

    @GetMapping("/user/{userId}")
    String userName(@PathVariable("userId") String userId) {
        log.info("Got a request");
        return myUserService.userName(userId);
    }
}
我们希望对 MyUserService#userName 方法进行详细的观测。由于添加了 AOP 支持,我们可以使用 @Observed 注解。为此,我们可以注册一个 ObservedAspect bean。
MyConfiguration.java
@Configuration(proxyBeanMethods = false)
class MyConfiguration {
    // To have the @Observed support we need to register this aspect
    @Bean
    ObservedAspect observedAspect(ObservationRegistry observationRegistry) {
        return new ObservedAspect(observationRegistry);
    }
}
MyUserService.java
@Service
class MyUserService {

    private static final Logger log = LoggerFactory.getLogger(MyUserService.class);

    private final Random random = new Random();

    // Example of using an annotation to observe methods
    // <user.name> will be used as a metric name
    // <getting-user-name> will be used as a span  name
    // <userType=userType2> will be set as a tag for both metric & span
    @Observed(name = "user.name",
            contextualName = "getting-user-name",
            lowCardinalityKeyValues = {"userType", "userType2"})
    String userName(String userId) {
        log.info("Getting user name for user with id <{}>", userId);
        try {
            Thread.sleep(random.nextLong(200L)); // simulates latency
        }
        catch (InterruptedException e) {
            throw new RuntimeException(e);
        }
        return "foo";
    }
}
在类路径上拥有指标和跟踪的情况下,此注解会导致创建 timer、long task timer 和 span。计时器将被命名为 user.name,长任务计时器将被命名为 user.name.active,跨度将被命名为 getting-user-name。
日志呢?我们不想在每次观测发生时手动编写日志语句。我们可以做的是创建一个专用的处理程序,为每次观测记录一些文本。
MyHandler.java
// Example of plugging in a custom handler that in this case will print a statement before and after all observations take place
@Component
class MyHandler implements ObservationHandler<Observation.Context> {

    private static final Logger log = LoggerFactory.getLogger(MyHandler.class);

    @Override
    public void onStart(Observation.Context context) {
        log.info("Before running the observation for context [{}], userType [{}]", context.getName(), getUserTypeFromContext(context));
    }

    @Override
    public void onStop(Observation.Context context) {
        log.info("After running the observation for context [{}], userType [{}]", context.getName(), getUserTypeFromContext(context));
    }

    @Override
    public boolean supportsContext(Observation.Context context) {
        return true;
    }

    private String getUserTypeFromContext(Observation.Context context) {
        return StreamSupport.stream(context.getLowCardinalityKeyValues().spliterator(), false)
                .filter(keyValue -> "userType".equals(keyValue.getKey()))
                .map(KeyValue::getValue)
                .findFirst()
                .orElse("UNKNOWN");
    }
}
就是这样!是时候进行客户端了。
和以前一样,我们添加 spring-boot-starter-web 和 spring-boot-starter-actuator 依赖项,以使 Web 服务器运行并添加 Micrometer 支持。
是时候添加与可观测性相关的功能了!
指标
io.micrometer:micrometer-registry-prometheus 依赖项。跟踪
对于使用 Micrometer Tracing 的跟踪上下文传播,我们需要选择一个tracer桥。我们通过添加 io.micrometer:micrometer-tracing-bridge-otel 来选择 OpenTelemetry。
为了进行延迟可视化,我们需要将完成的跨度以某种格式发送到服务器。在我们的例子中,我们生成一个 OpenZipkin 兼容的跨度。为了实现这一点,我们需要添加 io.opentelemetry:opentelemetry-exporter-zipkin 依赖项。
日志
com.github.loki4j:loki-logback-appender 依赖项(查看 此链接 获取最新发布版本)以将日志发送到 Loki。现在我们需要添加一些配置。我们添加了与服务器端几乎相同的配置。
/src/main/resources/application.properties
server.port=6543
spring.application.name=client

# All traces should be sent to latency analysis tool
management.tracing.sampling.probability=1.0
management.endpoints.web.exposure.include=prometheus

# traceID and spanId are predefined MDC keys - we want the logs to include them
logging.pattern.level=%5p [${spring.application.name:},%X{traceId:-},%X{spanId:-}]
Loki Appender 的配置看起来完全相同。
/src/main/resources/logback-spring.xml
<?xml version="1.0" encoding="UTF-8"?>
<configuration>
    <include resource="org/springframework/boot/logging/logback/base.xml" />
    <springProperty scope="context" name="appName" source="spring.application.name"/>

    <appender name="LOKI" class="com.github.loki4j.logback.Loki4jAppender">
        <http>
            <url>https://:3100/loki/api/v1/push</url>
        </http>
        <format>
            <label>
                <pattern>app=${appName},host=${HOSTNAME},traceID=%X{traceId:-NONE},level=%level</pattern>
            </label>
            <message>
                <pattern>${FILE_LOG_PATTERN}</pattern>
            </message>
            <sortByTime>true</sortByTime>
        </format>
    </appender>

    <root level="INFO">
        <appender-ref ref="LOKI"/>
    </root>
</configuration>
现在是时候编写一些客户端代码了!我们使用 RestTemplate 向服务器端发送请求,我们希望实现应用程序的全面可观测性,包括指标和跟踪。
首先,我们需要一个由 Spring Boot 自动检测的 RestTemplate bean。请记住注入 RestTemplateBuilder 并从构建器构造一个 RestTemplate 实例。
MyConfiguration.java
@Configuration(proxyBeanMethods = false)
class MyConfiguration {
    // IMPORTANT! To instrument RestTemplate you must inject the RestTemplateBuilder
    @Bean
    RestTemplate restTemplate(RestTemplateBuilder builder) {
        return builder.build();
    }
}
现在我们可以编写一个由 Observation API 包装并向服务器端发送请求的 CommandLineRunner bean。API 的所有部分都在以下代码片段中更详细地描述。
MyConfiguration.java
@Configuration(proxyBeanMethods = false)
class MyConfiguration {
    @Bean
    CommandLineRunner myCommandLineRunner(ObservationRegistry registry, RestTemplate restTemplate) {
        Random highCardinalityValues = new Random(); // Simulates potentially large number of values
        List<String> lowCardinalityValues = Arrays.asList("userType1", "userType2", "userType3"); // Simulates low number of values
        return args -> {
            String highCardinalityUserId = String.valueOf(highCardinalityValues.nextLong(100_000));
            // Example of using the Observability API manually
            // <my.observation> is a "technical" name that does not depend on the context. It will be used to name e.g. Metrics
             Observation.createNotStarted("my.observation", registry)
                     // Low cardinality means that the number of potential values won't be big. Low cardinality entries will end up in e.g. Metrics
                    .lowCardinalityKeyValue("userType", randomUserTypePicker(lowCardinalityValues))
                     // High cardinality means that the number of potential values can be large. High cardinality entries will end up in e.g. Spans
                    .highCardinalityKeyValue("userId", highCardinalityUserId)
                     // <command-line-runner> is a "contextual" name that gives more details within the provided context. It will be used to name e.g. Spans
                    .contextualName("command-line-runner")
                     // The following lambda will be executed with an observation scope (e.g. all the MDC entries will be populated with tracing information). Also the observation will be started, stopped and if an error occurred it will be recorded on the observation
                    .observe(() -> {
                        log.info("Will send a request to the server"); // Since we're in an observation scope - this log line will contain tracing MDC entries ...
                        String response = restTemplate.getForObject("https://:7654/user/{userId}", String.class, highCardinalityUserId); // Boot's RestTemplate instrumentation creates a child span here
                        log.info("Got response [{}]", response); // ... so will this line
                    });

        };
    }
}
我们已在 此链接 下准备了整个可观测性基础设施的 Docker 设置。按照以下步骤运行基础设施和两个应用程序。
运行示例
启动可观测性堆栈(为了演示目的,您可以使用提供的 Grafana、Tempo 和 Loki 堆栈)并等待其启动。
$ docker compose up
要访问 Prometheus,请访问 https://:9090/
要访问 Grafana,请访问 https://:3000/
运行服务器端应用程序(这将阻塞您当前的终端窗口)。
$ ./mvnw spring-boot:run -pl :server
运行客户端应用程序(这将阻塞您当前的终端窗口)
$ ./mvnw spring-boot:run -pl :client
您应该看到类似以下的日志语句
2022-10-04T15:04:55.345+02:00  INFO [client,bbe3aea006077640b66d40f3e62f04b9,93b7a150b7e293ef] 92556 --- [           main] com.example.client.ClientApplication     : Will send a request to the server
2022-10-04T15:04:55.385+02:00  INFO [client,bbe3aea006077640b66d40f3e62f04b9,93b7a150b7e293ef] 92556 --- [           main] com.example.client.ClientApplication     : Got response [foo]
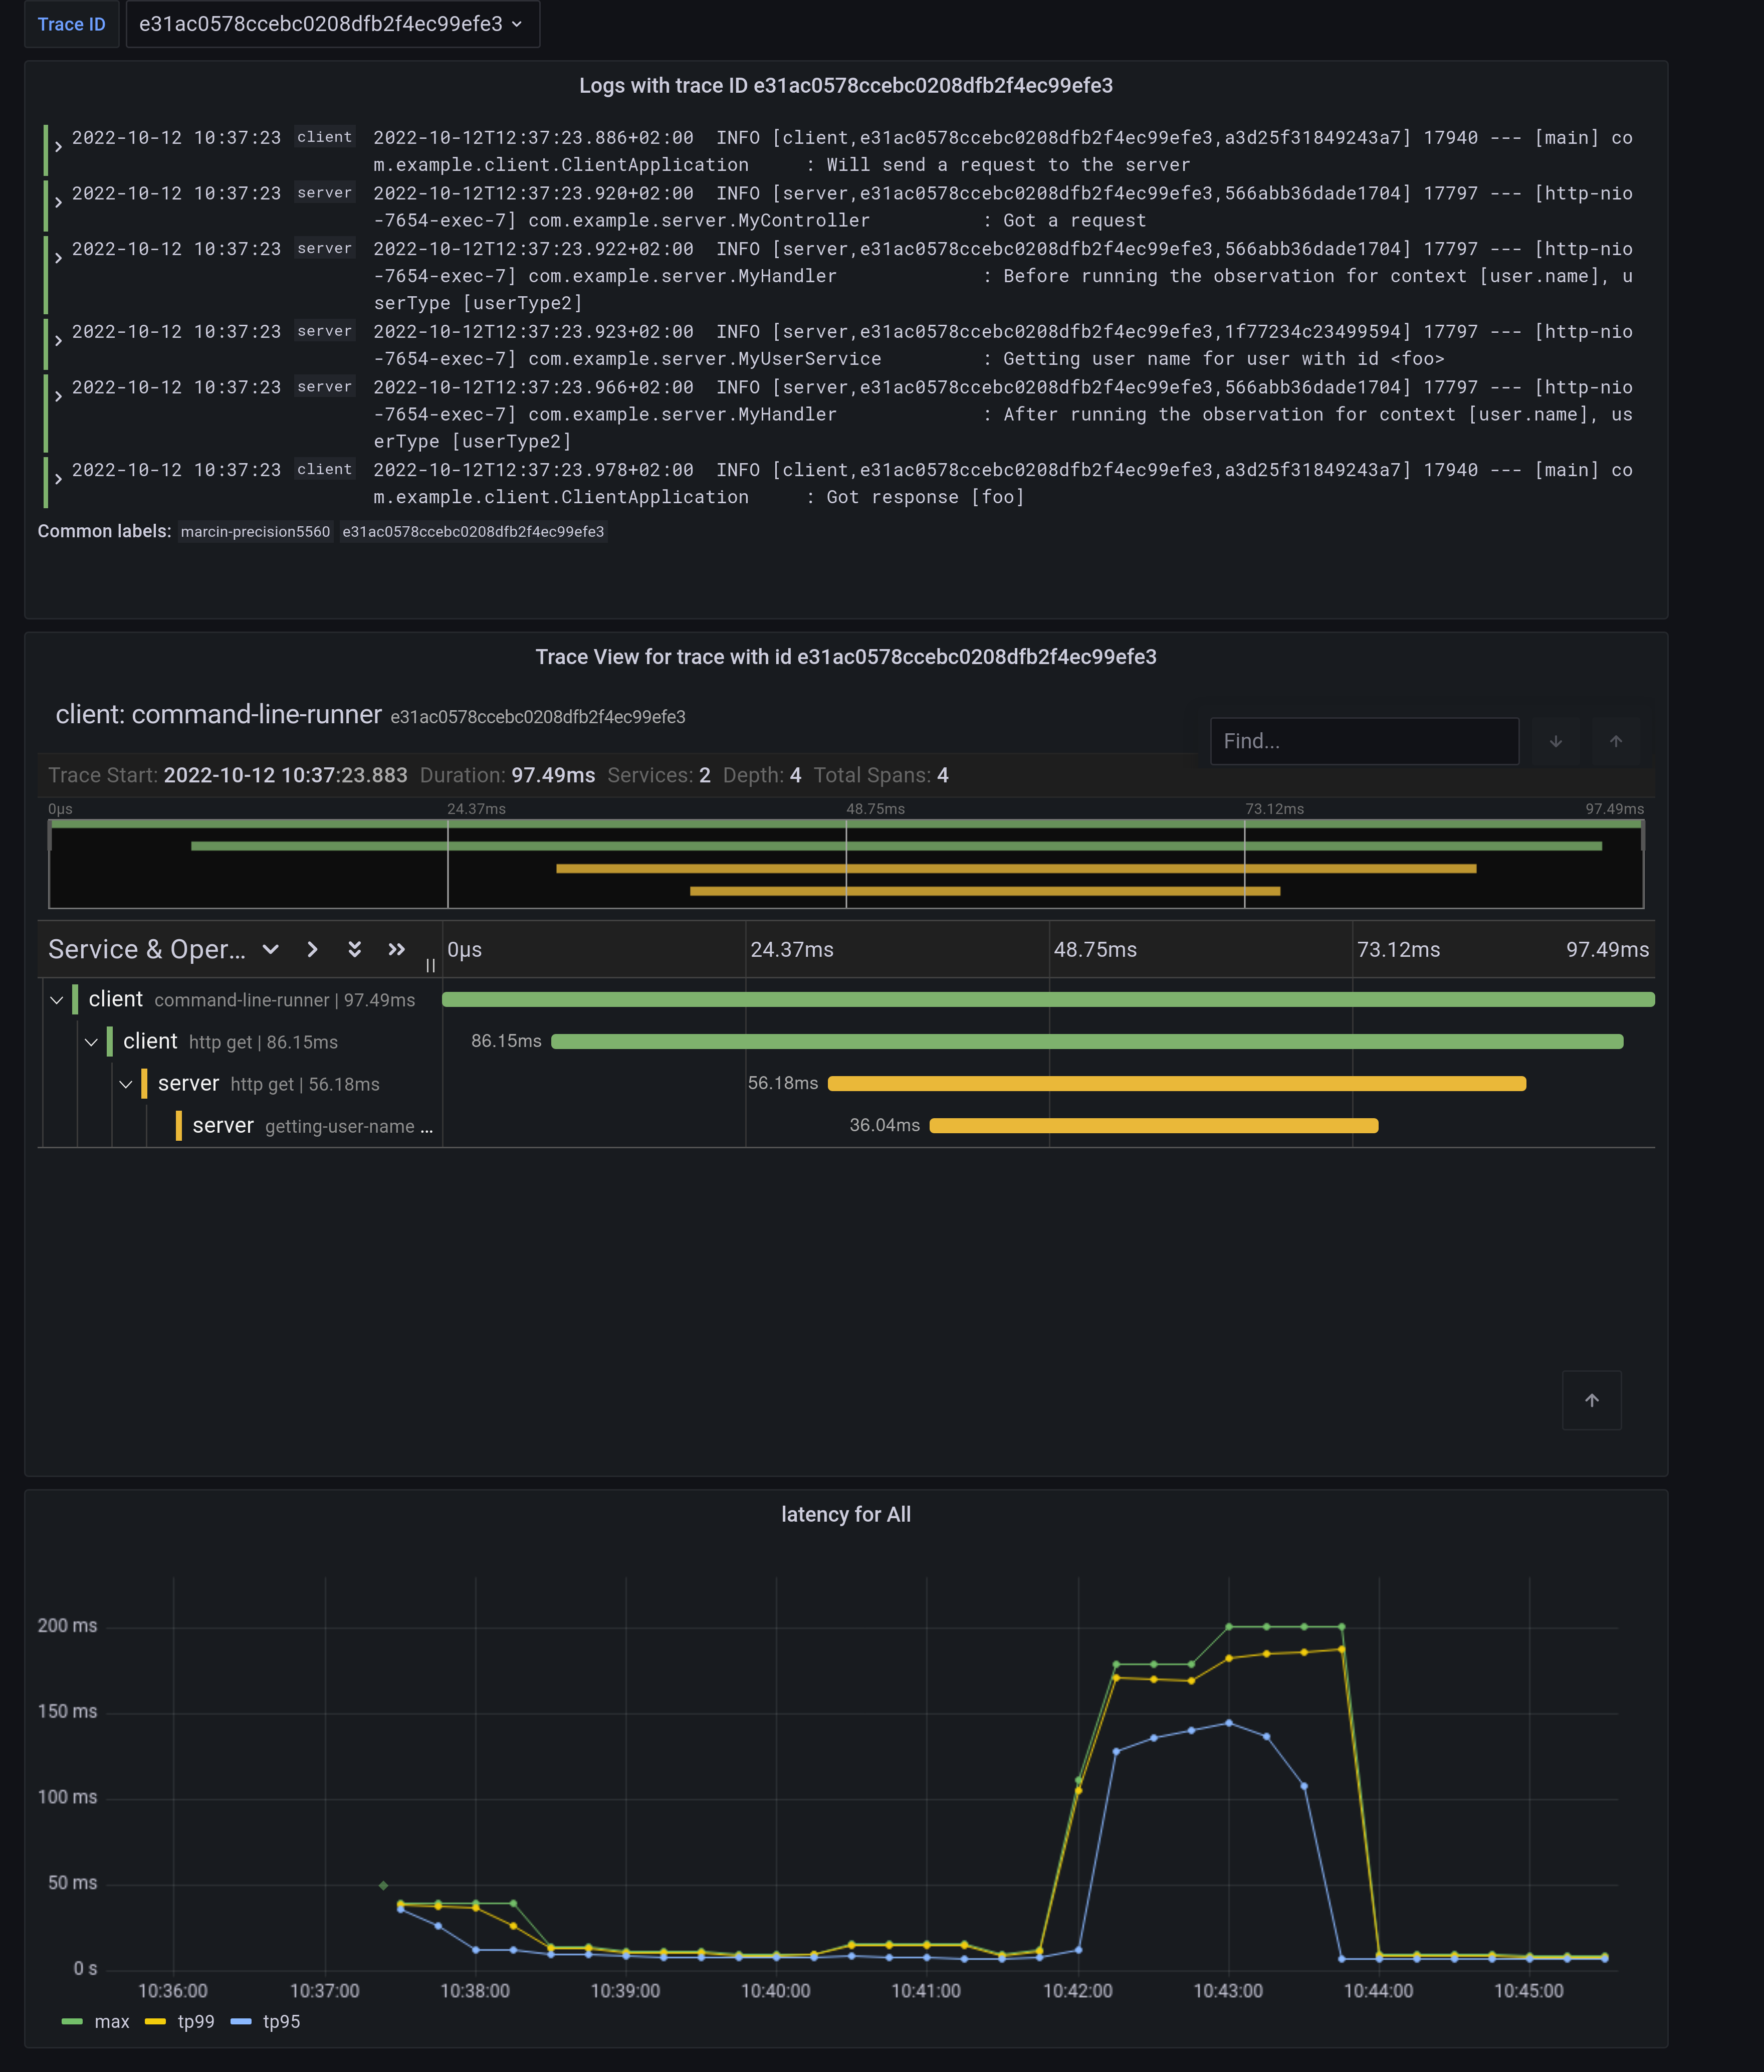
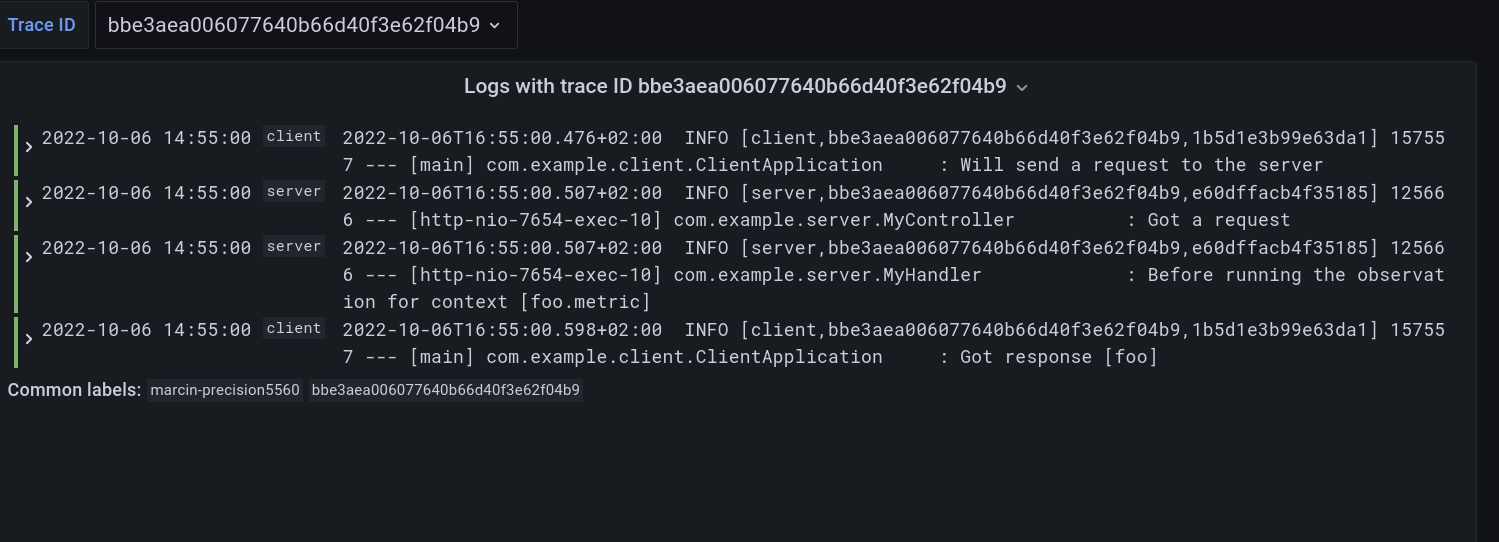
进入 Grafana,进入仪表板,点击 Logs, Traces, Metrics 仪表板。您可以在那里选择一个跟踪 ID 值(例如,bbe3aea006077640b66d40f3e62f04b9)以查找与该跟踪 ID 对应的来自两个应用程序的所有日志和跟踪。您应该会看到与同一跟踪标识符相关的日志和跟踪的以下关联视图,并且您将看到在相同时间范围内发生的指标。这些指标与 HTTP 请求处理延迟相关。这些来自使用 Micrometer API 的自动 Spring Boot WebMvc 检测。
请注意指标中的菱形。这些是 Exemplars。它们是“在给定时间间隔内进行的测量的特定追踪代表”。如果您点击该形状,您可以跳转到追踪 ID 视图以查看相应的追踪。
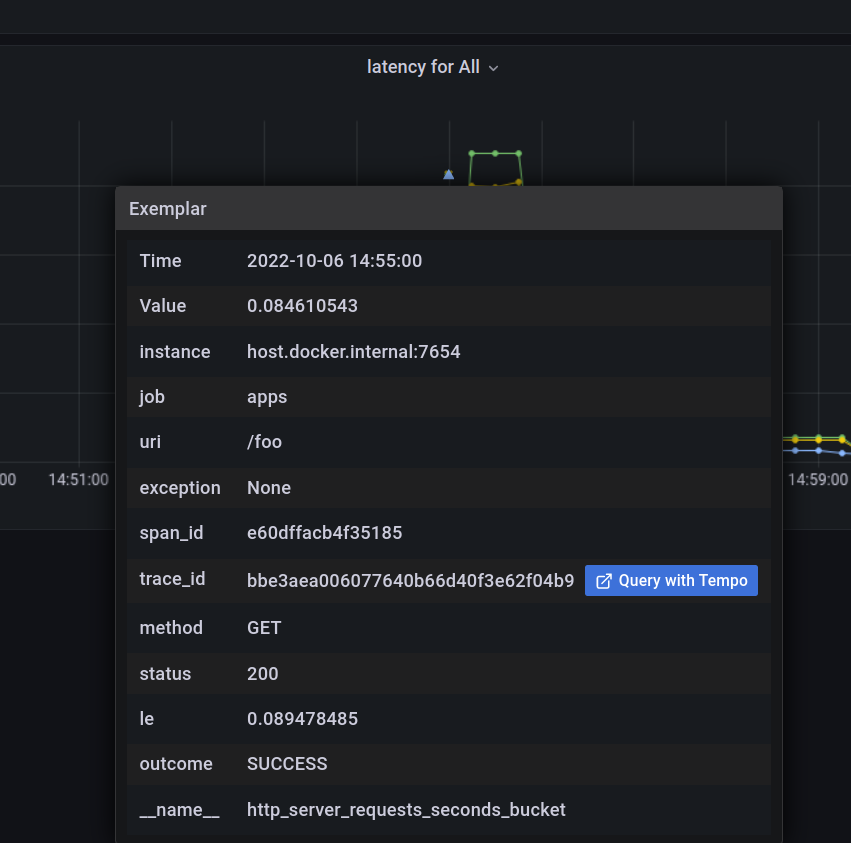
要么单击追踪 ID 以 Query it with Tempo,要么转到 Tempo 并自行选择追踪标识符。您将看到以下屏幕。
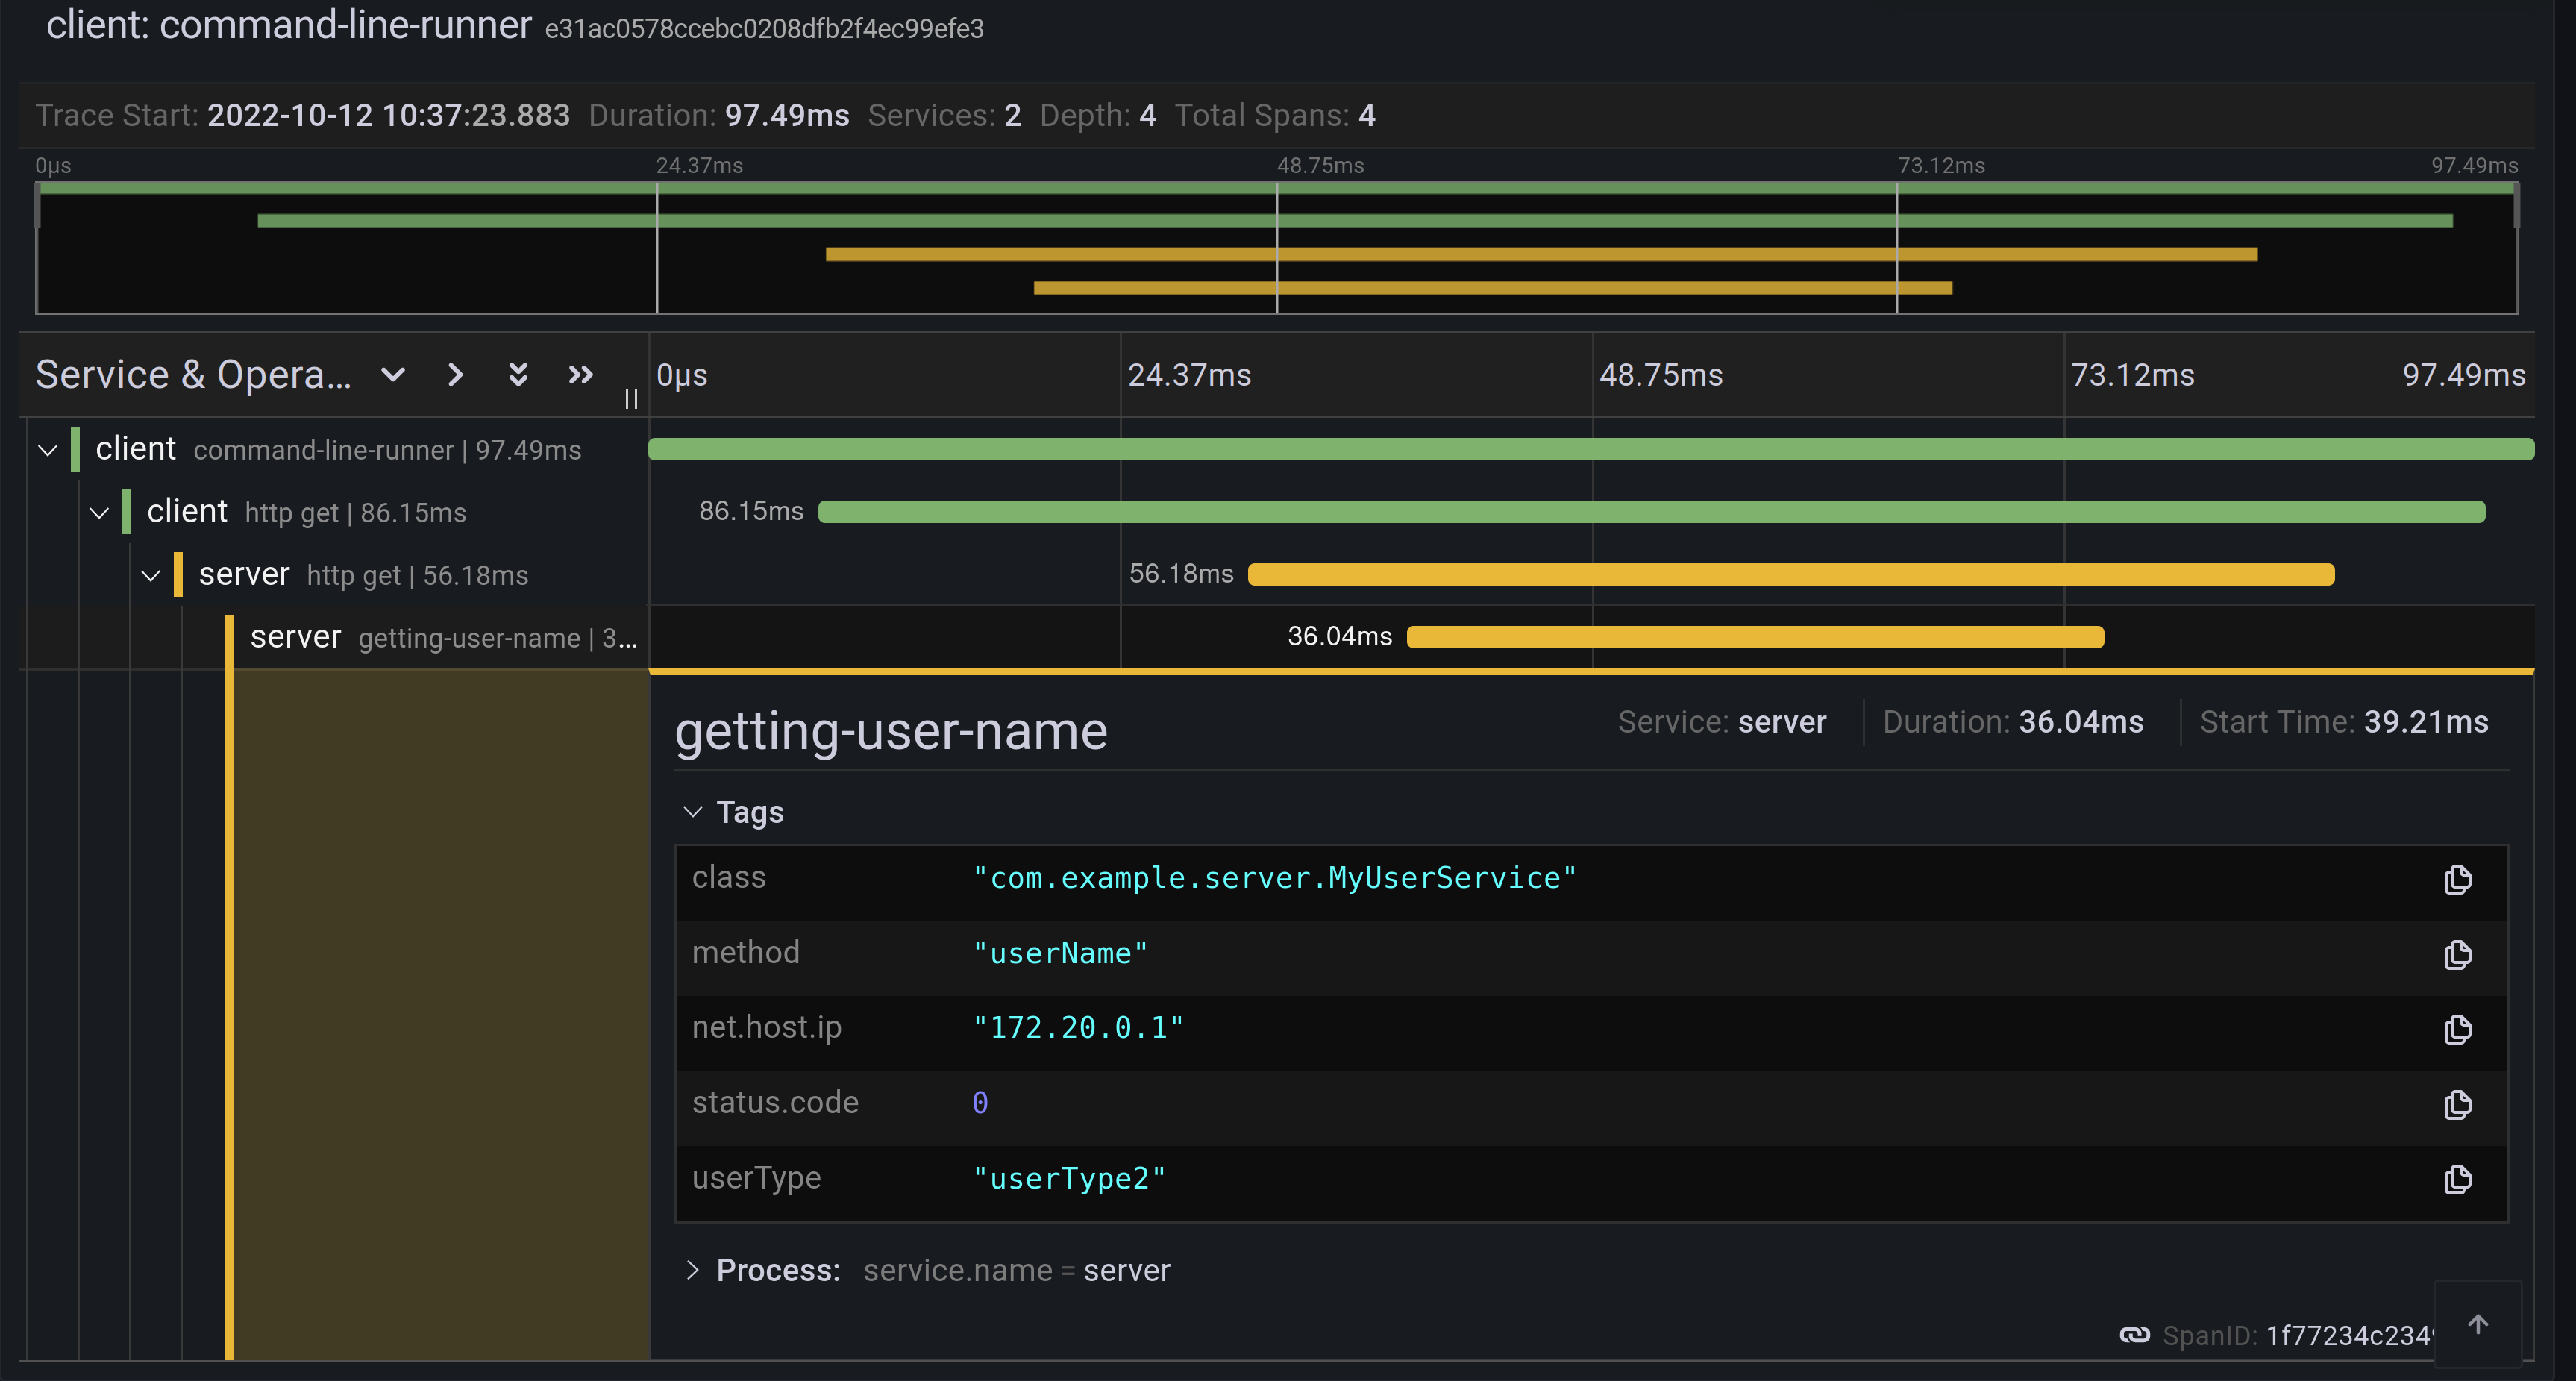
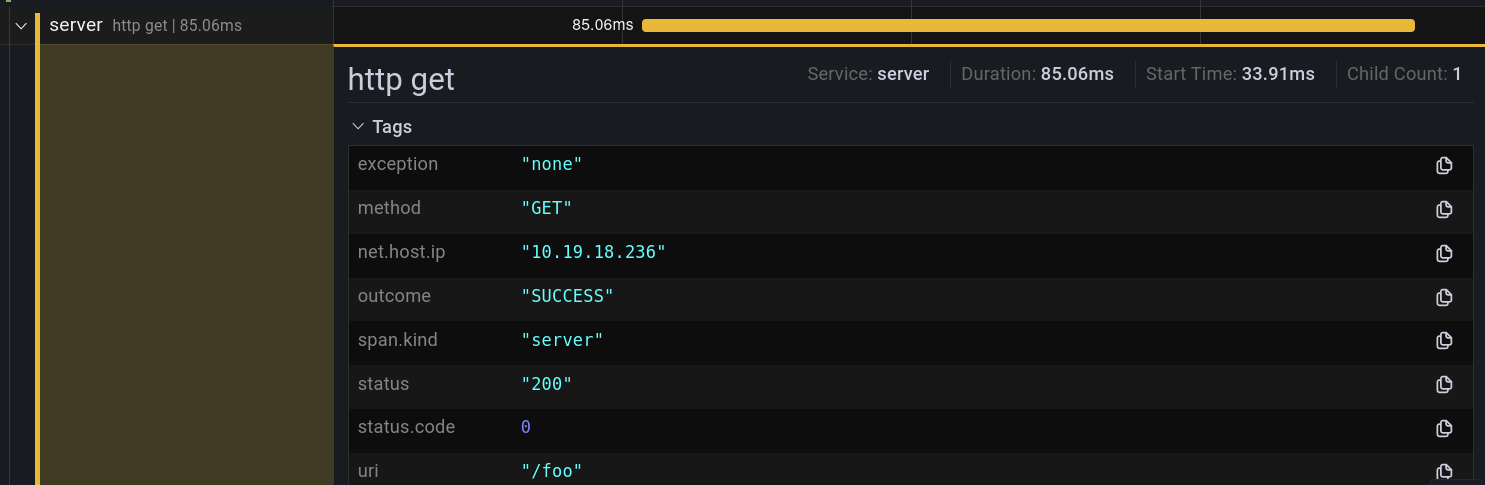
每个条形代表一个 span。您可以查看每个操作完成所需的时间。如果您单击给定的跨度,您可以看到与该特定操作相关的标签(键值元数据)和时间信息。
这是 Loki 中关联日志视图的样子。
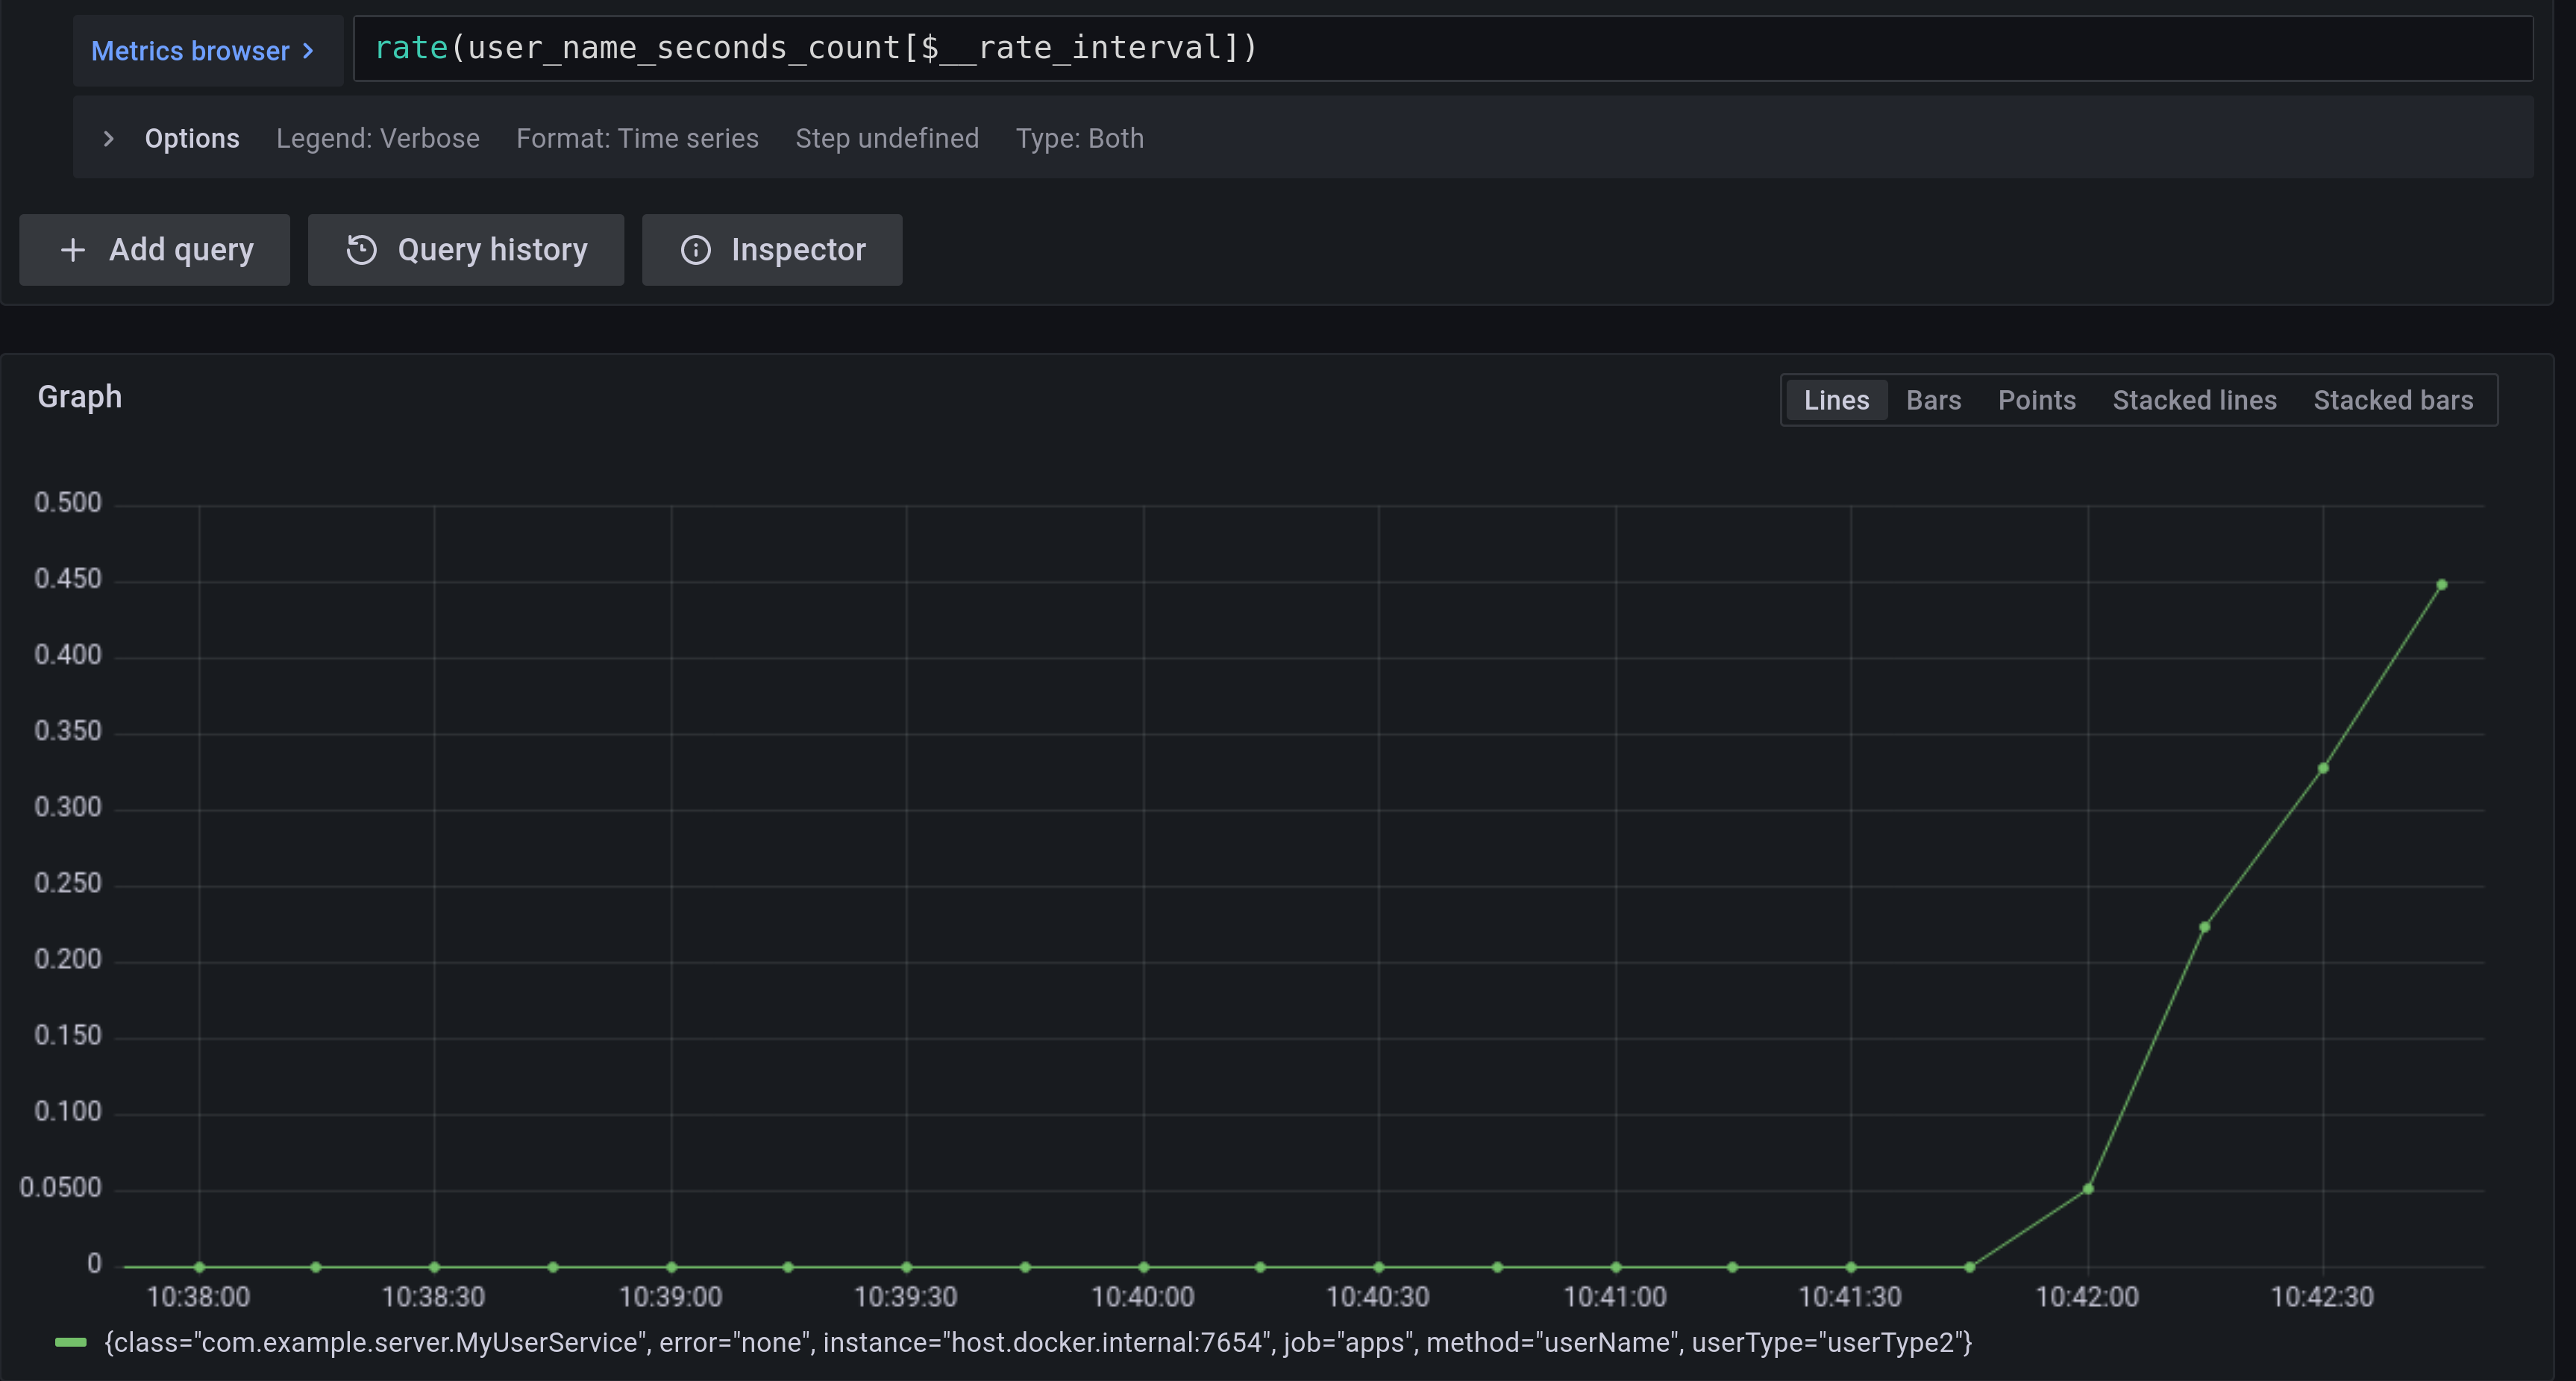
如果您想查看 @Observed 注解方法的指标,您可以前往 Prometheus 视图并找到 user_name 定时器。
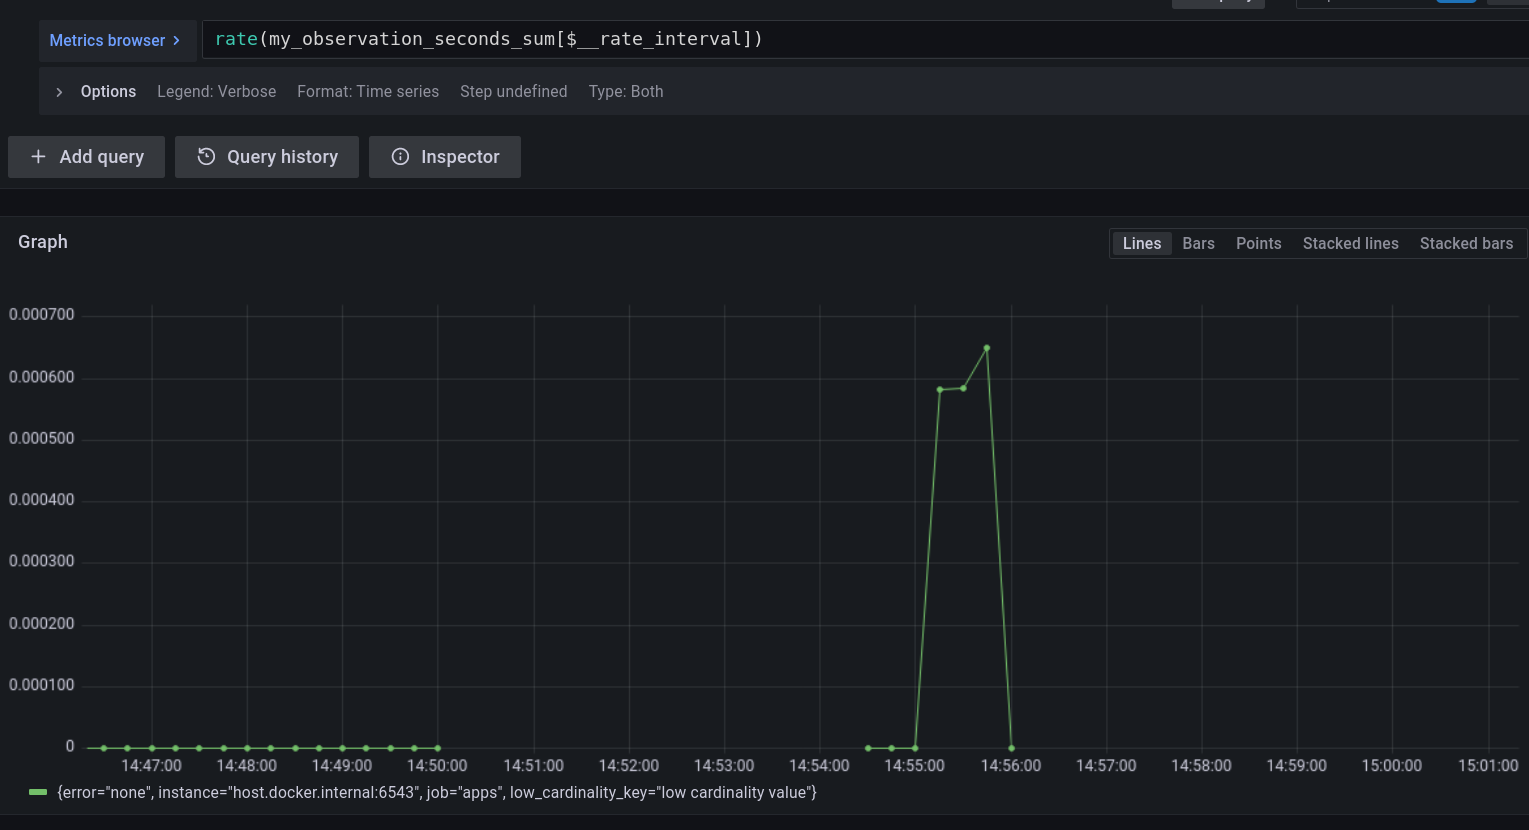
如果您想查看您手动创建的 Observation 的指标,请转到 Prometheus 视图并找到 my_observation 定时器。
为了更好地理解 Spring Boot 如何支持 Native,请阅读 这篇优秀的博客文章。我们重用这些知识来使用 Spring Native 运行之前创建的应用程序。
要构建应用程序,您需要在路径中配置 GraalVM。如果您使用 SDKMan,请调用以下命令
sdk install java 22.3.r17.ea-nik
另请参阅 GraalVM 快速入门。
要使用 Maven 构建应用程序,您需要启用 native 配置文件
$ ./mvnw native:compile -Pnative
首先运行服务器端应用程序
$ ./server/target/server
接下来,运行客户端应用程序。
$ ./client/target/client
您应该会得到类似以下的输出
客户端日志
2022-10-10T12:57:17.712+02:00  INFO \[client,,\] 82009 --- \[           main\] com.example.client.ClientApplication     : Starting ClientApplication using Java 17.0.4 on marcin-precision5560 with PID 82009 (/home/marcin/repo/observability/blogs/bootRc1/client/target/client started by marcin in /home/marcin/repo/observability/blogs/bootRc1)
2022-10-10T12:57:17.712+02:00  INFO \[client,,\] 82009 --- \[           main\] com.example.client.ClientApplication     : No active profile set, falling back to 1 default profile: "default"
2022-10-10T12:57:17.723+02:00  INFO \[client,,\] 82009 --- \[           main\] o.s.b.w.embedded.tomcat.TomcatWebServer  : Tomcat initialized with port(s): 6543 (http)
2022-10-10T12:57:17.723+02:00  INFO \[client,,\] 82009 --- \[           main\] o.apache.catalina.core.StandardService   : Starting service \[Tomcat\]
2022-10-10T12:57:17.723+02:00  INFO \[client,,\] 82009 --- \[           main\] o.apache.catalina.core.StandardEngine    : Starting Servlet engine: \[Apache Tomcat/10.0.23\]
2022-10-10T12:57:17.727+02:00  INFO \[client,,\] 82009 --- \[           main\] o.a.c.c.C.\[Tomcat\].\[localhost\].\[/\]       : Initializing Spring embedded WebApplicationContext
2022-10-10T12:57:17.727+02:00  INFO \[client,,\] 82009 --- \[           main\] w.s.c.ServletWebServerApplicationContext : Root WebApplicationContext: initialization completed in 15 ms
2022-10-10T12:57:17.731+02:00  WARN \[client,,\] 82009 --- \[           main\] i.m.c.i.binder.jvm.JvmGcMetrics          : GC notifications will not be available because MemoryPoolMXBeans are not provided by the JVM
2022-10-10T12:57:17.781+02:00  INFO \[client,,\] 82009 --- \[           main\] o.s.b.a.e.web.EndpointLinksResolver      : Exposing 15 endpoint(s) beneath base path '/actuator'
2022-10-10T12:57:17.783+02:00  INFO \[client,,\] 82009 --- \[           main\] o.s.b.w.embedded.tomcat.TomcatWebServer  : Tomcat started on port(s): 6543 (http) with context path ''
2022-10-10T12:57:17.783+02:00  INFO \[client,,\] 82009 --- \[           main\] com.example.client.ClientApplication     : Started ClientApplication in 0.077 seconds (process running for 0.079)
2022-10-10T12:57:17.784+02:00  INFO \[client,27c1113e4276c4173daec3675f536bf4,e0f2db8b983607d8\] 82009 --- \[           main\] com.example.client.ClientApplication     : Will send a request to the server
2022-10-10T12:57:17.820+02:00  INFO \[client,27c1113e4276c4173daec3675f536bf4,e0f2db8b983607d8\] 82009 --- \[           main\] com.example.client.ClientApplication     : Got response \[foo\]
2022-10-10T12:57:18.966+02:00  INFO \[client,,\] 82009 --- \[nio-6543-exec-1\] o.a.c.c.C.\[Tomcat\].\[localhost\].\[/\]       : Initializing Spring DispatcherServlet 'dispatcherServlet'
2022-10-10T12:57:18.966+02:00  INFO \[client,,\] 82009 --- \[nio-6543-exec-1\] o.s.web.servlet.DispatcherServlet        : Initializing Servlet 'dispatcherServlet'
2022-10-10T12:57:18.966+02:00  INFO \[client,,\] 82009 --- \[nio-6543-exec-1\] o.s.web.servlet.DispatcherServlet        : Completed initialization in 0 ms
服务器端日志
2022-10-10T12:57:07.200+02:00  INFO \[server,,\] 81760 --- \[           main\] com.example.server.ServerApplication     : Starting ServerApplication using Java 17.0.4 on marcin-precision5560 with PID 81760 (/home/marcin/repo/observability/blogs/bootRc1/server/target/server started by marcin in /home/marcin/repo/observability/blogs/bootRc1)
2022-10-10T12:57:07.201+02:00  INFO \[server,,\] 81760 --- \[           main\] com.example.server.ServerApplication     : No active profile set, falling back to 1 default profile: "default"
2022-10-10T12:57:07.213+02:00  INFO \[server,,\] 81760 --- \[           main\] o.s.b.w.embedded.tomcat.TomcatWebServer  : Tomcat initialized with port(s): 7654 (http)
2022-10-10T12:57:07.213+02:00  INFO \[server,,\] 81760 --- \[           main\] o.apache.catalina.core.StandardService   : Starting service \[Tomcat\]
2022-10-10T12:57:07.213+02:00  INFO \[server,,\] 81760 --- \[           main\] o.apache.catalina.core.StandardEngine    : Starting Servlet engine: \[Apache Tomcat/10.0.23\]
2022-10-10T12:57:07.217+02:00  INFO \[server,,\] 81760 --- \[           main\] o.a.c.c.C.\[Tomcat\].\[localhost\].\[/\]       : Initializing Spring embedded WebApplicationContext
2022-10-10T12:57:07.217+02:00  INFO \[server,,\] 81760 --- \[           main\] w.s.c.ServletWebServerApplicationContext : Root WebApplicationContext: initialization completed in 16 ms
2022-10-10T12:57:07.222+02:00  WARN \[server,,\] 81760 --- \[           main\] i.m.c.i.binder.jvm.JvmGcMetrics          : GC notifications will not be available because MemoryPoolMXBeans are not provided by the JVM
2022-10-10T12:57:07.278+02:00  INFO \[server,,\] 81760 --- \[           main\] o.s.b.a.e.web.EndpointLinksResolver      : Exposing 15 endpoint(s) beneath base path '/actuator'
2022-10-10T12:57:07.280+02:00  INFO \[server,,\] 81760 --- \[           main\] o.s.b.w.embedded.tomcat.TomcatWebServer  : Tomcat started on port(s): 7654 (http) with context path ''
2022-10-10T12:57:07.281+02:00  INFO \[server,,\] 81760 --- \[           main\] com.example.server.ServerApplication     : Started ServerApplication in 0.086 seconds (process running for 0.088)
2022-10-10T12:57:07.639+02:00  INFO \[server,,\] 81760 --- \[nio-7654-exec-1\] o.a.c.c.C.\[Tomcat\].\[localhost\].\[/\]       : Initializing Spring DispatcherServlet 'dispatcherServlet'
2022-10-10T12:57:07.639+02:00  INFO \[server,,\] 81760 --- \[nio-7654-exec-1\] o.s.web.servlet.DispatcherServlet        : Initializing Servlet 'dispatcherServlet'
2022-10-10T12:57:07.640+02:00  INFO \[server,,\] 81760 --- \[nio-7654-exec-1\] o.s.web.servlet.DispatcherServlet        : Completed initialization in 1 ms
2022-10-10T12:57:17.785+02:00  INFO \[server,,\] 81760 --- \[nio-7654-exec-8\] com.example.server.MyHandler             : Before running the observation for context \[http.server.requests\]
2022-10-10T12:57:17.785+02:00  INFO \[server,27c1113e4276c4173daec3675f536bf4,9affba5698490e2d\] 81760 --- \[nio-7654-exec-8\] com.example.server.MyController          : Got a request
2022-10-10T12:57:17.820+02:00  INFO \[server,,\] 81760 --- \[nio-7654-exec-8\] com.example.server.MyHandler             : After running the observation for context \[http.server.requests\]
您可以检查 Grafana 以获取指标、跟踪和日志!
在客户端,我们需要手动提供 reflect-config.js 配置。有关更多信息,请参阅 此 PR。
在这篇博客文章中,我们向您介绍了 Micrometer Observability API 的主要概念。我们还向您展示了如何使用 Observation API 和注解创建观测。您还可以可视化延迟、查看关联日志并检查来自 Spring Boot 应用程序的指标。
您还可以使用 Spring Native 的原生镜像来观测您的应用程序。
如果没有整个 Spring 团队、Tadaya Tsuyukubo、Johnny Lim 以及所有其他贡献者和审阅者的广泛支持,Micrometer Observability 的工作是不可能完成的。
基于社区反馈,我们将继续改进我们的可观测性故事。我们计划在今年11月发布GA版本。
这对我们来说是一个激动人心的时刻。我们再次感谢所有已经贡献并提供反馈的人,我们期待更多的反馈!请查看 Spring Boot 的最新快照!请查看我们项目的文档:Micrometer 上下文传播、Micrometer、Micrometer 观测、Micrometer 跟踪 和 Micrometer 文档生成器!点击这里查看本博客文章使用的代码。